05. K-means Playground
K-means Playground
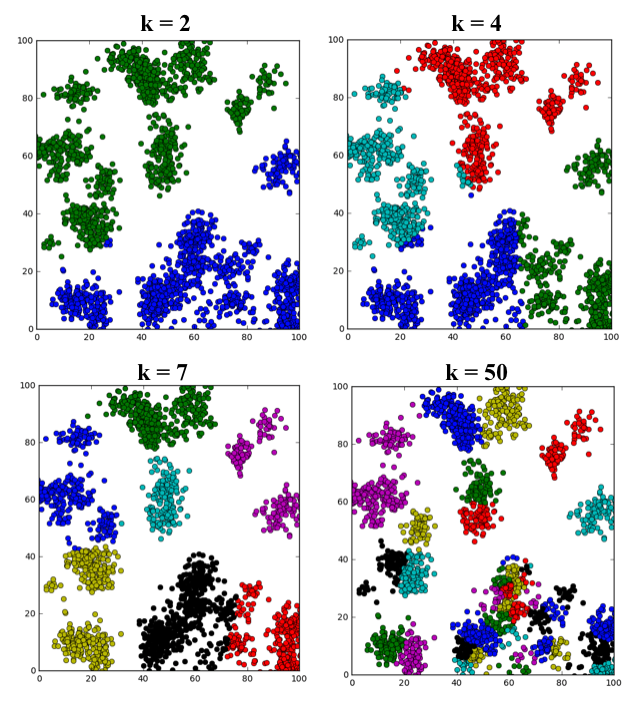
An example of running k-means clustering on the same dataset with different values of k (note: in the k = 50 plot, colors are getting repeated but denote separate clusters).
The k-means Algorithm
The k-means clustering algorithm works like this:
Suppose you have a set of n data points: p_1,p_2,…, p_n and you intend to divide the data into k clusters.
- Start by selecting k individual points c_1,c_2,…,c_k from the dataset as the initial cluster centroids.
- Define convergence / termination criteria (stability of solution and max number of iterations)
- while convergence / termination criteria are not met do:
- for i = 1 to n:
- Calculate distance from p_i to each cluster centroid
- Assign p_i to its closest centroid and label it accordingly
- endfor
- For j = 1 to k:
- Recompute the centroid of cluster j based on the average of all data point that belog to the cluster
- endfor
- endwhile
Testing k-means
K-means clustering is a powerful tool but it also has its limitations. In this exercise I've set you up with a sandbox environment in the code quiz editor below, where you can test the boundaries of the k-means algorithm. There are lots of knobs to turn and parameters to tweak here so let's first step through the code.
The first thing to do is generate some clusters! I've provided you with a function called cluster_gen() that will generate simple cluster populations drawing from random Gaussian distributions. Have a look at the functions in the np.random package to how these functions work and what other distributions you might draw from. Here's how cluster_gen() is defined:
# Define a function to generate clusters
def cluster_gen(n_clusters, pts_minmax=(10, 100), x_mult=(1, 4), y_mult=(1, 3),
                             x_off=(0, 50), y_off=(0, 50)):

    # n_clusters = number of clusters to generate
    # pts_minmax = range of number of points per cluster
    # x_mult = range of multiplier to modify the size of cluster in the x-direction
    # y_mult = range of multiplier to modify the size of cluster in the y-direction
    # x_off = range of cluster position offset in the x-direction
    # y_off = range of cluster position offset in the y-direction

    # Initialize some empty lists to receive cluster member positions
    clusters_x = []
    clusters_y = []

    # Generate random values given parameter ranges
    n_points = np.random.randint(pts_minmax[0], pts_minmax[1], n_clusters)
    x_multipliers = np.random.randint(x_mult[0], x_mult[1], n_clusters)
    y_multipliers = np.random.randint(y_mult[0], y_mult[1], n_clusters)
    x_offsets = np.random.randint(x_off[0], x_off[1], n_clusters)
    y_offsets = np.random.randint(y_off[0], y_off[1], n_clusters)

    # Generate random clusters given parameter values
    for idx, npts in enumerate(n_points):

        xpts = np.random.randn(npts) * x_multipliers[idx] + x_offsets[idx]
        ypts = np.random.randn(npts) * y_multipliers[idx] + y_offsets[idx]
        clusters_x.append(xpts)
        clusters_y.append(ypts)

    # Return cluster positions
    return clusters_x, clusters_y
cluster_gen() contains lots of tweakable parameters that allow you to change the distribution of clusters you generate, but the only parameter you're required to provide to this function is the number of clusters you want to generate n_clusters. All the other parameters come set to default values that are optional to change.
To generate some clusters you can call it like this:
# Generate some clusters!
n_clusters = 7
clusters_x, clusters_y = cluster_gen(n_clusters)

# Convert to a single dataset in OpenCV format
data = np.float32((np.concatenate(clusters_x), np.concatenate(clusters_y))).transpose()
With your clusters generated, you need to convert the data into a format that OpenCV likes, then define the constraints for the k-means algorithm, and finally call the cv2.kmeans() function.
# Define k-means parameters
# Number of clusters to define
k_clusters = 7
# Maximum number of iterations to perform
max_iter = 10
# Accuracy criterion for stopping iterations
epsilon = 1.0
# Define criteria in OpenCV format
criteria = (cv2.TERM_CRITERIA_EPS + cv2.TERM_CRITERIA_MAX_ITER, 10, 1.0)
# Call k-means algorithm on your dataset
compactness, label, center = cv2.kmeans(data, k_clusters, None, criteria, 10, cv2.KMEANS_RANDOM_CENTERS)
You can extract the individual clusters for plotting like this:
# Define some empty lists to receive k-means cluster points
kmeans_clusters_x = []
kmeans_clusters_y = []

# Extract k-means clusters from output
for idx in range (k_clusters):
    kmeans_clusters_x.append(data[label.ravel()==idx][:,0])
    kmeans_clusters_y.append(data[label.ravel()==idx][:,1])
And finally, plot it up!
# Plot up a comparison of original clusters vs. k-means clusters
fig = plt.figure(figsize=(12,6))
plt.subplot(121)
min_x = np.min(data[:, 0])
max_x = np.max(data[:, 0])
min_y = np.min(data[:, 1])
max_y = np.max(data[:, 1])
for idx, xpts in enumerate(clusters_x):
    plt.plot(xpts, clusters_y[idx], 'o')
    plt.xlim(min_x, max_x)
    plt.ylim(min_y, max_y)
    plt.title('Original Clusters')
plt.subplot(122)
for idx, xpts in enumerate(kmeans_clusters_x):
    plt.plot(xpts, kmeans_clusters_y[idx], 'o')
    plt.xlim(min_x, max_x)
    plt.ylim(min_y, max_y)
    plt.title('k-means Clusters')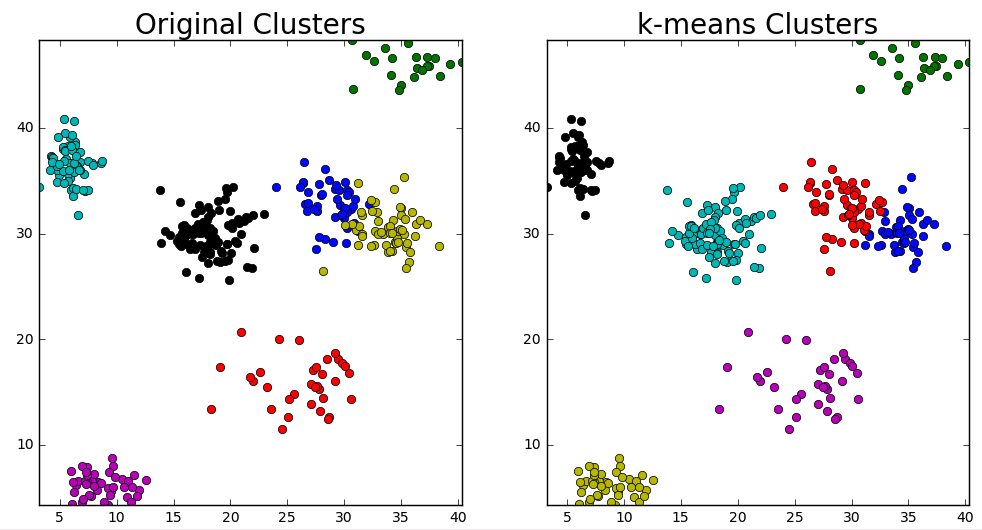
Looks like it pretty much worked! Try this in the editor below, does it always work? Copy and run this code on your local machine if you want to try running cv2.kmeans() multiple times on the same dataset (the quiz editor generates a new random dataset with each run).
Parameters to Tweak
There are lots of parameters that you can tweak and they will affect the data you generate and the result you get from running cv2.kmeans(). Keep the following in mind as you experiment in the playground:
n_clustersandk_clustersneed not be the same number!- In your call to
cluster_gen()you can tweakpts_minmax,x_mult,y_mult,x_offandy_offto change the size and shape of the clusters you generate. - The criteria you set for your k-means algorithm,
max_iterandepsilonwill determine when the algorithm stops iterating.
Have fun! And if you want to check out an even fancier k-means playground check out Naftali Harris' site.
Start Quiz: